At work we have started using opentracing with a zipkin backend and elasticsearch as storage layer. Zipkin creates per-day indices inside elasticsearch, meaning we can use the raw data to generate correct response time percentiles for individual services grouped by date.
After an initial draft which used a HdrHistogram on the client side Zachary Tong, an elastic.co employee, suggested on twitter to use the build-in HdrHistogram in elasticsearch instead.
The resulting code is a little shorter, and runs much faster due to the fact that we cut down the amount of data needed to be transfered.
Let’s take the latest version apart:
Our elasticsearch backend is running on AWS so we need to configure the elastic client to skip healthchecks:
client, err := elastic.NewClient(
  elastic.SetURL("http://127.0.0.1:9200"),
  elastic.SetHealthcheck(false),
  elastic.SetSniff(false),
)
if client == nil || err != nil {
  panic(fmt.Errorf("Failed retrieving an client: %#v", err))
}
Also note that our elasticsearch cluster is configured to be only accessible via v4 signed requests, which is achieved by running an aws signing proxy locally.
Now that we have a properly configured client we need to create an elasticsearch query which
allows us to look only at traces for a single service.
Opentracing by default adds a binaryAnnotation like this:
{
  "endpoint": {
    "serviceName": "service-a"
  }
}
knowning that these binaryAnnotations will be set for all traces, we can create a query
which filters out all unwanted documents:
service := "service-a"

b := elastic.NewBoolQuery()
b.Must(elastic.NewMatchQuery("binaryAnnotations.endpoint.serviceName", service))

q := elastic.NewNestedQuery(
  "binaryAnnotations",
  b,
)
Now that we can filter documents by individual services we need to instruct elasticsearch to execute a percentiles aggregation.
The elastic client has support for percentiles aggregations, but these use TDigest by default. For HdrHistograms we need to
add a hdr key.
To do this in Go, we need to fulfill the elastic.Aggregation interface ourselves:
type Aggregation interface {
  // Source returns a JSON-serializable aggregation that is a fragment
  // of the request sent to Elasticsearch.
  Source() (interface{}, error)
}
This can easily be achieved by struct embedding:
type hdrPercentilesAggregation struct {
  *elastic.PercentilesAggregation
}

func (c *hdrPercentilesAggregation) Source() (interface{}, error) {
  s, err := c.PercentilesAggregation.Source()
  if err != nil {
    return nil, err
  }

  m := s.(map[string]interface{})
  percentiles := m["percentiles"].(map[string]interface{})
  percentiles["hdr"] = map[string]interface{}{
    "number_of_significant_value_digits": 3,
  }

  return m, nil
}
With this change we can instruct elasticsearch to calculate response time percentiles using HdrHistograms, knowing that opentracing-go adds a duration key:
agg := elastic.NewPercentilesAggregation()
agg.Field("duration")

sr, err := client.Search().Index(index).Query(q).Aggregation("duration", &hdrPercentilesAggregation{agg}).Do()
if err != nil {
  return nil, err
}
res, found := sr.Aggregations.Percentiles("duration")
if !found {
  return nil, fmt.Errorf("Missing aggregation %q from result set", "duration")
}
The requested percentiles are inside the res.Values map.
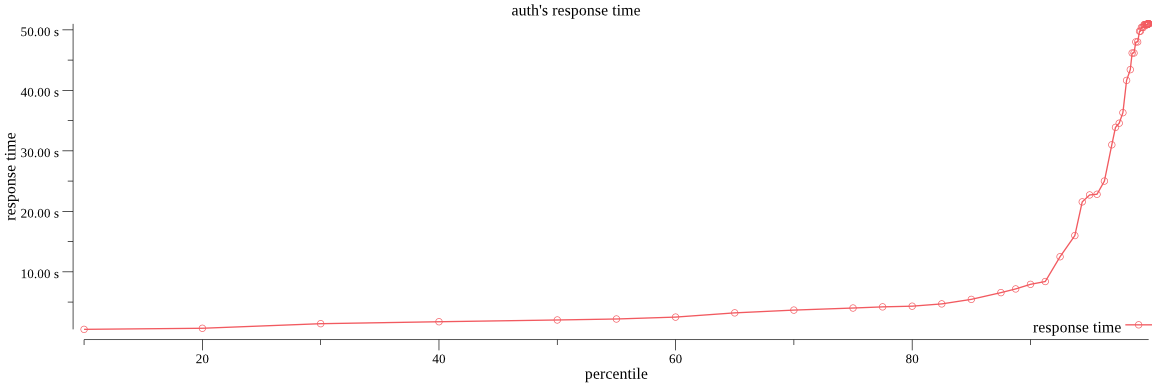
It’s straight forward to generate images from this data via the really great github.com/gonum/plot package - but see for yourself.
the gist contains a binary that generates csvs or pngs for a specific service & time range:
$ go run plot.go main.go -csv=false -img=true -prefix zipkin- service-a 2016-12-01 2016-12-20