I was looking for a nice IDE integrated on-chip debugging setup for STM32 chips and the STLink V3 on macOS. Neither OpenOCD nor st-util worked out of the box with CLion. I didn’t want to use gdb directly.
STCubeIDE works great, but I don’t want to use STCubeMX projects. I’m writing firmware using chibios right now. I wanted something which works for any RTOS without much hastle.
So I took some inspiration from how STCubeIDE works. For the following steps to work you must have STCubeIDE installed on you local system, including all of the dependencies it needs to work properly: stlink-server and STCubeProgrammer:
- find the bin folder of the stlink-gdb-server plugin in STCubeIDE:
❯ find /Applications/STM32CubeIDE.app | grep -E "stlink-gdb-server.*/tools/bin$"
/Applications/STM32CubeIDE.app/Contents/Eclipse/plugins/com.st.stm32cube.ide.mcu.externaltools.stlink-gdb-server.macos64_1.4.0.202007081208/tools/bin
In my case it is
/Applications/STM32CubeIDE.app/Contents/Eclipse/plugins/com.st.stm32cube.ide.mcu.externaltools.stlink-gdb-server.macos64_1.4.0.202007081208/tools/bin
- Modify config.txt to point to the location of your STCubeProgrammer:
❯ vim /Applications/STM32CubeIDE.app/Contents/Eclipse/plugins/com.st.stm32cube.ide.mcu.externaltools.stlink-gdb-server.macos64_1.4.0.202007081208/tools/bin/config.txt
make sure the line for the -cp option points to your STCubeProgrammer bin directory:
-cp /Applications/STMicroelectronics/STM32Cube/STM32CubeProgrammer/STM32CubeProgrammer.app/Contents/MacOs/bin/
- Start stlink-gdb-server:
❯ (cd /Applications/STM32CubeIDE.app/Contents/Eclipse/plugins/com.st.stm32cube.ide.mcu.externaltools.stlink-gdb-server.macos64_1.4.0.202007081208/tools/bin && ./ST-LINK_gdbserver.sh)


STMicroelectronics ST-LINK GDB server. Version 5.6.0
Copyright (c) 2020, STMicroelectronics. All rights reserved.

Starting server with the following options:
        Persistent Mode            : Enabled
        LogFile Name               : debug.log
        Logging Level              : 31
        Listen Port Number         : 61234
        Status Refresh Delay       : 15s
        Verbose Mode               : Disabled
        SWD Debug                  : Enabled

Target connection mode: Default
Hardware watchpoint supported by the target
COM frequency = 24000 kHz
ST-LINK Firmware version : V3J7M2B4S1
Device ID: 0x422
PC: 0x80002d0
ST-LINK device status: HALT_MODE
ST-LINK detects target voltage = 2.97 V
ST-LINK device status: HALT_MODE
ST-LINK device initialization OK
Waiting for debugger connection...
Waiting for connection on port 61234...
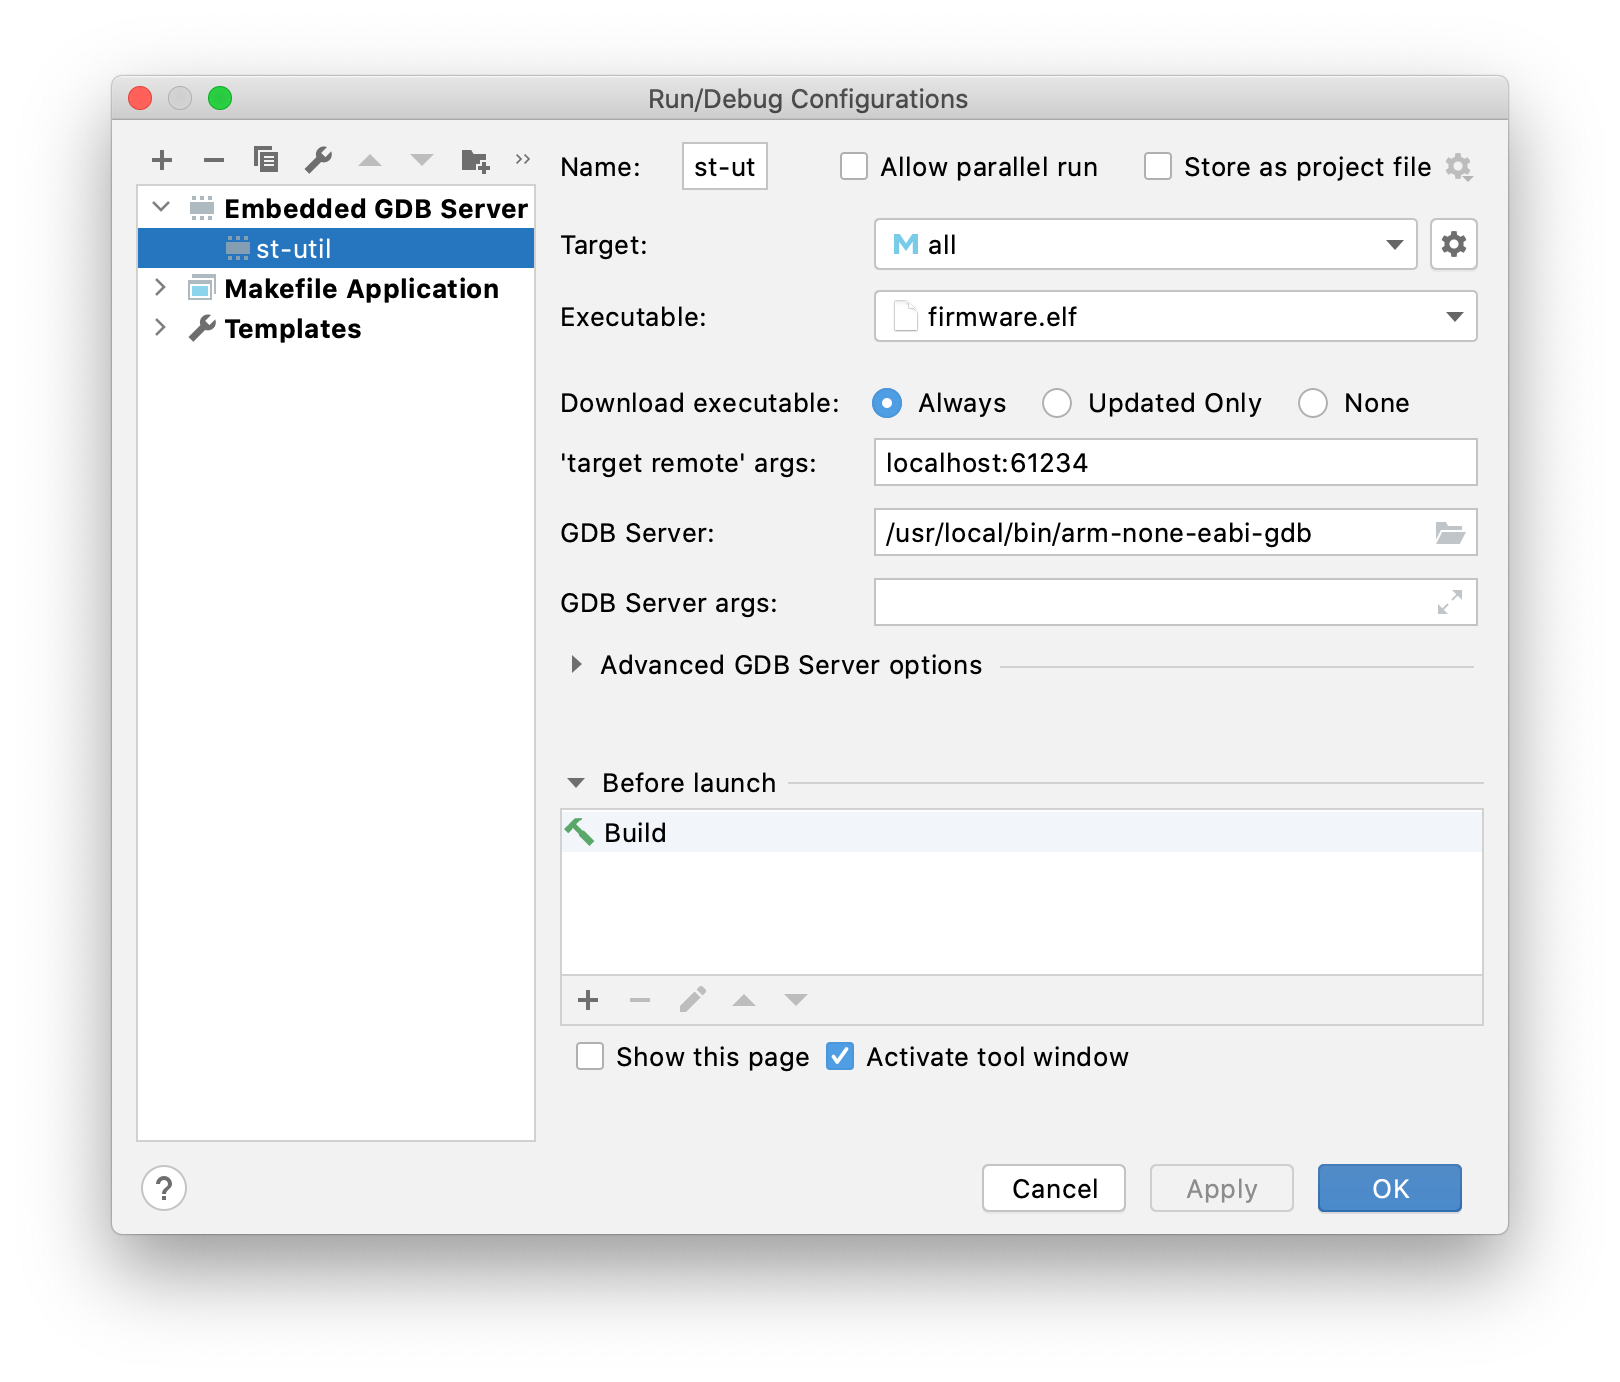
- Configure CLion
Under Run/Debug Configurations:
Setup a new Embedded GDB Server, with target remote args: localhost:61234, and GDB Server to your arm-none-eabi-gdb binary.
That’s it! You can now connect to your device and debug it, with all the nice features of CLion;
Happy debugging :)